Chi-squared Distribution
October 19, 2021
Fundamentals
Waveform Display
Domains for Analysis
Random Vibration
Back to: Introduction to Vibration Signals
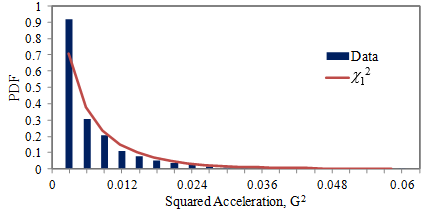
Random closed-loop vibration controllers can produce a control acceleration with a power spectral density (PSD) comparable to the demand spectrum (G2/Hz). The control should exhibit Gaussian statistics that are reflected in a bell-shaped probability density function (PDF). This expectation is partially derived from chi-squared (χ2) statistics.
 The chi-squared distribution is a theoretical distribution that helps explain the observed distribution. Among other applications, it estimates the confidence interval for the variance of a random variable from a normal distribution.
Statistically reasonable variations for a control PSD are determined from confidence and degrees of freedom; both are derived from chi-squared distribution.
Chi-squared Distribution
Chi-squared is the distribution of a sum of squared random variables. It is a PDF that describes the likelihood of a sample’s amplitude being within certain bounds.
The operator/program takes a sample from a normal distribution and squares the value to calculate the distribution. If there are multiple samples, the squared values are added together.
Chi-squared is only applicable when the analysis items are samples from a Gaussian distribution squared. Random shaker control fits this model.
Degrees-of-Freedom
The number of samples taken from a normal distribution determines the distribution’s degrees of freedom (DOF). A chi-squared distribution with N DOF determines the probability of a normal distribution with a mean value of 0 and a variance of 1.
For example, if the operator/program were to take three samples from a normal distribution, square the samples separately, and then add them, then the chi-squared distribution would have a DOF of 3.
For vibration controllers, the DOF describes the amount of averaging (or smoothing) in the analysis of a signal to generate a PSD. DOF is not a property of the control signal but is a characteristic of signal analysis.
Statistical Confidence
For a random vibration test, the amplitude of every spectral line of the control signal’s PSD is determined by confidence limits derived from the chi-squared distribution. Statistical confidence is often expressed as a percentage. For example, 99.9% confidence conveys that 99.9% of the PSD’s spectral lines will be within the curve-specified upper and lower bounds.
Control-Loop Error
The visual difference between the control PSD and demand is often described as the control-loop error. However, it displays the summation of two errors: the loop error and the PSD estimation error.
- The loop error is the difference between the expected value of the control PSD and the demand profile.
- The PSD estimation error is the natural scattering of measurement around the expected value.
As it is not practical to average the control PSD for infinity, we must use an estimate averaged over a finite time. Therefore, any deviation of the expected value from the demand could be the result of either the loop error or PSD estimation error.
As we add more estimates of the control PSD to the average, the control more closely approaches the desired central value. However, averaging also blurs the detection of dynamic change in the control signal, thereby masking instantaneous loop error.
Real and Imaginary Numbers
To compute the PSD of a random Gaussian waveform, the vibration testing industry often uses the fast Fourier transform (FFT). The FFT is a linear transform and is provided with a Gaussian input. As a result, the FFT’s output at each frequency line is a complex number with a Gaussian real part and a Gaussian imaginary part.
An imaginary number is written as a real number multiplied by the imaginary unit (i). The imaginary unit is defined by the property i2 = −1; therefore, i is the square root of -1.
The real and imaginary parts of the FFT output are squared and then added to equate the magnitude. The square magnitude is a chi-squared distributed random variable with 2 DOF.
Conclusion
Chi-squared statistics help to form the reasonable expectation of a Gaussian time-history waveform. Specifically, this theoretical distribution governs the control’s variance and PSD for any random controller.