Reporting on Vibration Test Data
September 25, 2024
Initial Design
Data Analysis
Reporting
Back to: Making Sense of Test Data
Now that you’ve done the work of ensuring your test data are reliable, the next step is generating a report. Reports document a test’s procedures, parameters, and results and include data, test notes, graphs, statistics, and more.
Labs retain reports internally for reference and share them externally to convey test results to a client. Internally, reports serve as important historical documentation. Engineers can revisit reports to make comparisons and reference them during audits.
This lesson discusses best practices for reporting and navigates several tools in the VibrationVIEW Report Builder.
Preparing Comprehensive Test Reports
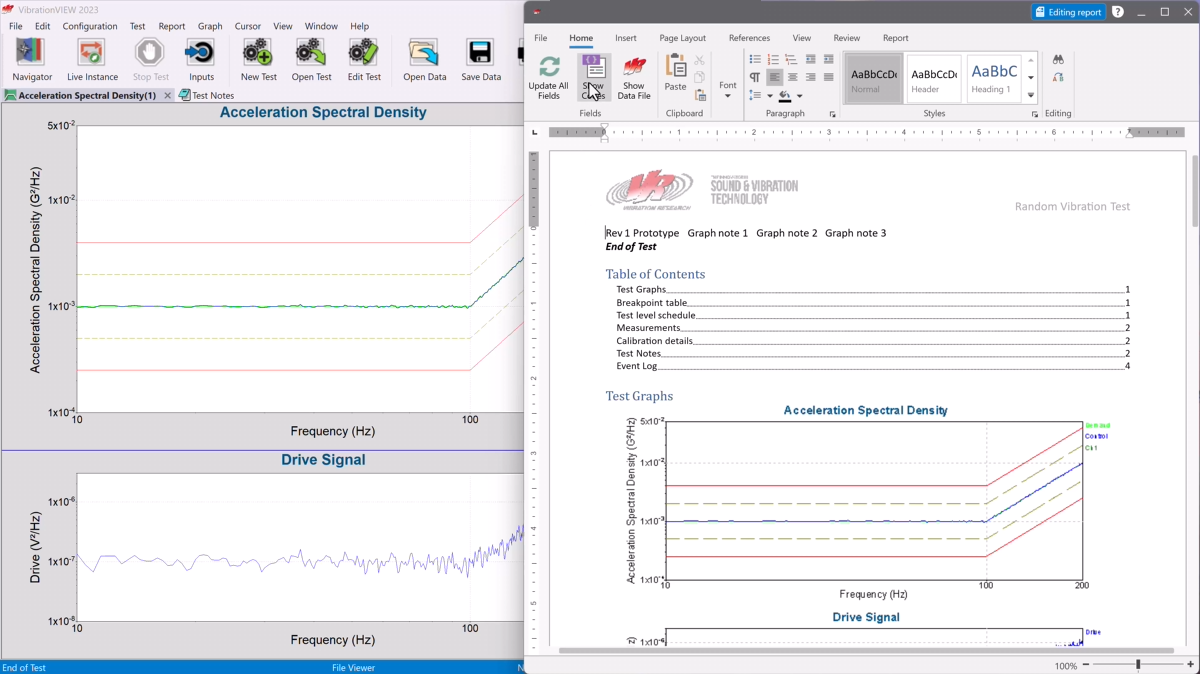
Report Builder in the VibrationVIEW software.
Primarily, a report should provide a clear visualization of the data, analysis, and conclusions. A third party should be able to review the document and arrive at the same conclusions.
Report data should be labeled, organized, and include any context necessary for understanding. Just because you know the context of a specific data set does not mean another engineer will, nor may you in a year. It is better to overshare than walk into an audit without an explanation for your test results.
What to Include in a Test Report
If you are running a vibration test from a standard, the documentation will likely instruct you on which information to include in your test report, at a minimum. Similarly, if running a test to meet regulatory and compliance requirements, you should review the regulatory body’s reporting requirements.
If running a custom test, you’ll decide what to include in your report based on the test type, goals, and results. At a minimum, we recommend including all test graphs, the breakpoint table, the test level schedule, channel measurements, calibration information, an event log, and test notes. VibrationVIEW includes report templates for each test type that include this basic information.
What Else?
When determining what to include in a test report, consider what information will convey the test results most clearly. The test data and resulting graphs may not be enough to draw a conclusion. In these cases, you can add results from a more comprehensive analysis.
In a previous lesson, we briefly discussed the transfer function and transmissibility. These analyses compare signals to understand the system’s dynamic behavior. The transfer function may more clearly display vibration amplification or phase shifts, and transmissibility can offer insights into resonance and damping.
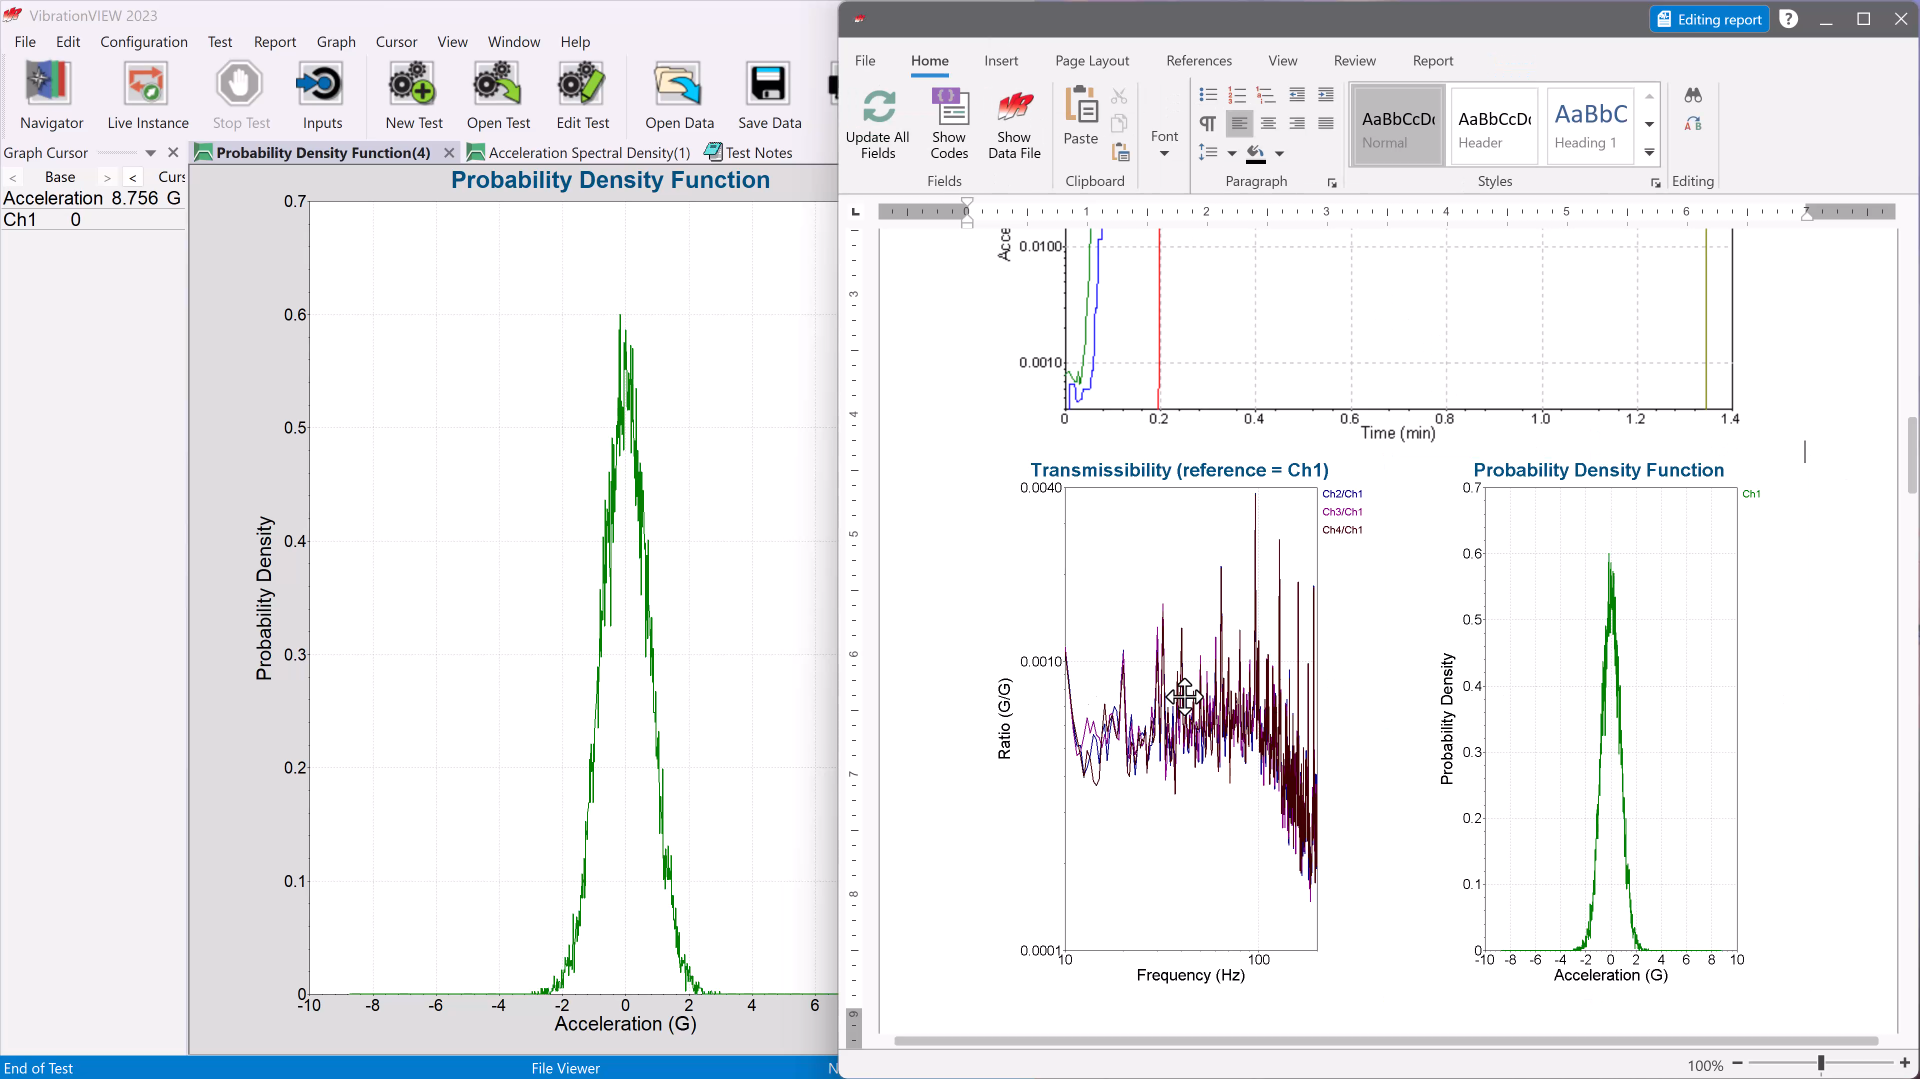
Carrying over graphs into a report.
In the case of random testing, statistics like RMS, peak, and kurtosis can help to explain test behavior. For a sine test, a resonance table lays out key information.
Engineers should also consider the information the lab may need to replicate a test or conform to an audit. Including system information like mass, shaker limits, software version, and hardware identification is part of proper documentation.
For an idea of what you can/should include in a test report, you can review the report parameters in the VibrationVIEW Report Builder. Users can search for categories and drag-drop values into their report. The categories coincide with the current test type.